MIXTRI 2.0 - an MS Excel 97 VBA macro to draw
LCA results in a mixing triangle (aka ternary plot)
Sample Graph |
Download Excel workbook |
Related 3rd party freeware |
References
Intro
The new damage-oriented method for Life Cycle Impact Assessment 'Eco-indicator'99'
allows to aggregate environmental effects in three damage categories:
damages to human health, ecosystem quality and resources.
To arrive at a single score environmental measure the relative weighting
of these three types of damages is required. Besides a - necessarily subjective - default weighting scheme
for these three damages one can also use a graphic
representation of all possible weighting schemes: the mixing triangle.
Within the triangle, preferred weighting points can be selected.
Different cultural archetypes, as described by Cultural Theory, opt for
typical weighting schemes within the triangle according to their cultural value setting.
Thus, this method is able to combine "hard" findings from life cycle inventories
with "soft" results from sociology, philosophy and psychology.
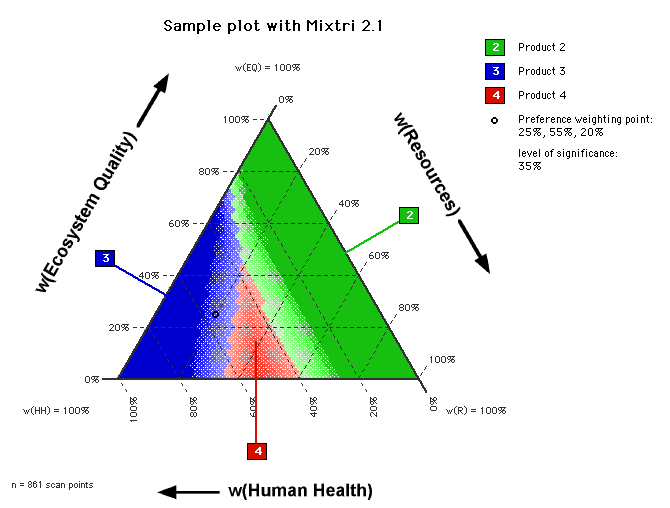
The triangle shows which
product is environmentally less burdening depending on the weighting
scheme for that point in the triangle. Lines of indifference can be drawn where two products cause equal
- or to be more precise: equally perceived -
damages.
I wrote an Excel VBA macro
scanning the whole weighting triangle for the best (or dominating) product option out of an unlimited number of product options.
Areas of dominance are faded to white when an other product scores close to the best product.
('closeness' is defined by the parameter  , this 'level of significance' is set to
35%, user definable.).
MIXTRI 2.0 saves plots as space saving GIF files approx 28kB (but retains an editable 300kB PICT copy in the clipboard).
Sample

Above you see a sample graph to compare the environmental impacts of a number of product options
and the various results when giving different weights
for damages to human health (HH), ecosystem quality (EQ), and resources (R).
Sum of the weights is always 100% for every point.
The triangle shows which product has the lowest burden.
Only two products (#2 and #3) have areas where they alone are significantly best (lowest burden and no hatching).
Product No. 4 has an unsignificant area of dominance (hatched), i.e. No. 4 is not significantly the best, but other products score comparably there.
Product No. 1 is not shown at all since it is never the best product.
Download
This is a workbook written on a German MS Excel 97
for Macintosh. Import to Windows machines, higher or other language
versions of Excel should not be a problem. If so; tell me.
NO manual available yet! coming soon...
The thing is checked and virus free. I can't take any responsibility for
this product, you use it on your own account. If you'd like to give me some
credit though, I won't mind. Have fun.
older Version 1.0, for 3 Products, with explicit lines of indifference
(262kB)
Other freeware for ternary plots
- The only other tool to draw ternary plots with dominance areas is
Pré's Triangle Tool
for PC-compatibles. Robust and quick. Unfortunately limited to 2 products only.
Some other freeware tools to draw ternary plots are listed below. Ternary plots
are mainly used in geology and chemistry and hence,
none of these are fit to show dominance areas, as my tool
does.
- TERNPLOT
by Daniel Marshall. A straight 104kB Excel4.0 sheet that draws 2D ternary
plots (sets of points in the triangle). Very versatile handling of 60
°
tickmarks.
- Trixcel
by Julien Furrer. An Excel 7.0 add-in for Windows with example sheet
that draws 2D ternary plots (sets of points in the triangle).
Comes with menu commands and a help function. Neat, but in French.
- tcontour
v3.03
by John Pilling. A 94kB standalone application (Macintosh) that draws
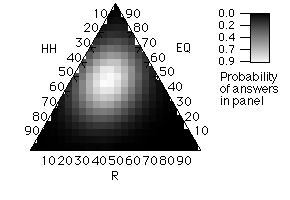
3D ternary plots like the one below (coloured areas within the triangle to represent a 4th parameter).
Not very self-explanatory.

References
- The mixing triangle concept for LCA was first described and published in
Patrick Hofstetters 1998 book "Perspectives in Life Cycle Impact Assessment -
A Structured Approach to Combine Models of the Technosphere, Ecosphere and Valuesphere",
Kluwer Academic Publishers, Boston/Dordrecht/London 1998,
p.359-373, available from Kluwer
Publishers.
- The Eco-indicator'99 methodology report is available from pré consultants.
More on the mixing triangle method can be read in the Box 7.1 on page
91ff. of that report.
- An article published in the Journal of Industrial Ecology presents the
method indepth:
Hofstetter P., Braunschweig A., Mettier Th.,
Müller-Wenk R., Tietje O., The Mixing triangle: Correlation and Graphical
Decision Support for LCA-based Comparisons, Journal of Industrial Ecology,
Volume 3, Number 4 (97-115) 2000
- More on the mixing triangle (aka ternary plot or triangle diagram)
can be read in the overview of graphical representations at STATSOFT.
- More on Life Cycle Assessment on my LCA hotlist.
Gabor Doka, Zürich, Switzerland,
3rd July 2000
![]() , this 'level of significance' is set to
35%, user definable.).
, this 'level of significance' is set to
35%, user definable.). 
