MS Excel has standard chart types for this:
 ...or this:
 ...or this:
...but not this:
 (Fig. 1)
 (Fig. 2)
 (Fig. 3)
The workbook below features a proper 3D scatterplot within MS Excel. The chart has these properties:
- Display points with arbitrary X/Y/Z values
- Rotate the plot freely in all three dimensions (see animated GIF 1MB, assembled from screenshots )
- Zoom into the plot and shift projection
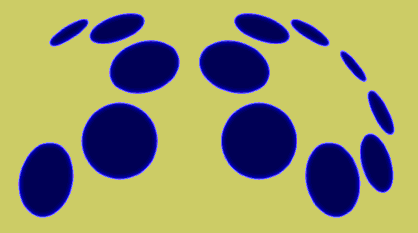
- Option to color points according to X,Y, or Z value or a 4th column, using a macro (see Fig. 1)
- Option to make 4D bubble plots (143kB JPG) according to X,Y, or Z value or a 4th column, using a macro (see Fig. 2)
- Vertical leading lines (143kB JPG) for the plotted points (see Fig. 3)
- Option to create dynamic labels for each point, using a macro
Inspired by Andy Pope's "Simulated 3d XY scatter"
http://www.andypope.info/charts.htm
This ZIP archive contains an Excel woorkbook with VBA macros and a PDF manual. The VBA code is free software. See GNU General Public License for
details.
Download Excel3Dscatterplotv2_3.zip (1.3 MB ZIP).
You are encouraged to send me nice samples of plots you have created with the help of this macro:
Gabor Doka: scaplo {at} doka {dot} ch
If you encounter problems, please contact me:
Gabor Doka: scaplo {at} doka {dot} ch
Copyleft © 2006-2022 Gabor Doka (scaplo {at} doka {dot} ch)
The 'Excel 3D Scatter Plot' macros and workbook are provided free of charge. They may be distributed freely provided
that all the worksheets, macros and documentation are always distributed together, in whole and unchanged.
The 'Excel 3D Scatter Plot' macros may not be sold or offered for sale, or included with another
software product offered for sale. Companies that distribute public domain/freeware/shareware
software for profit are expressly prohibited from distributing the 'Excel 3D Scatter Plot' workbook.
Programs in the distributed Excel document come with absolutely no warranty. These are free softwares, and you
are welcome to redistribute them under certain conditions. See GNU General Public License for
details.

 Doka Life Cycle Assessments